
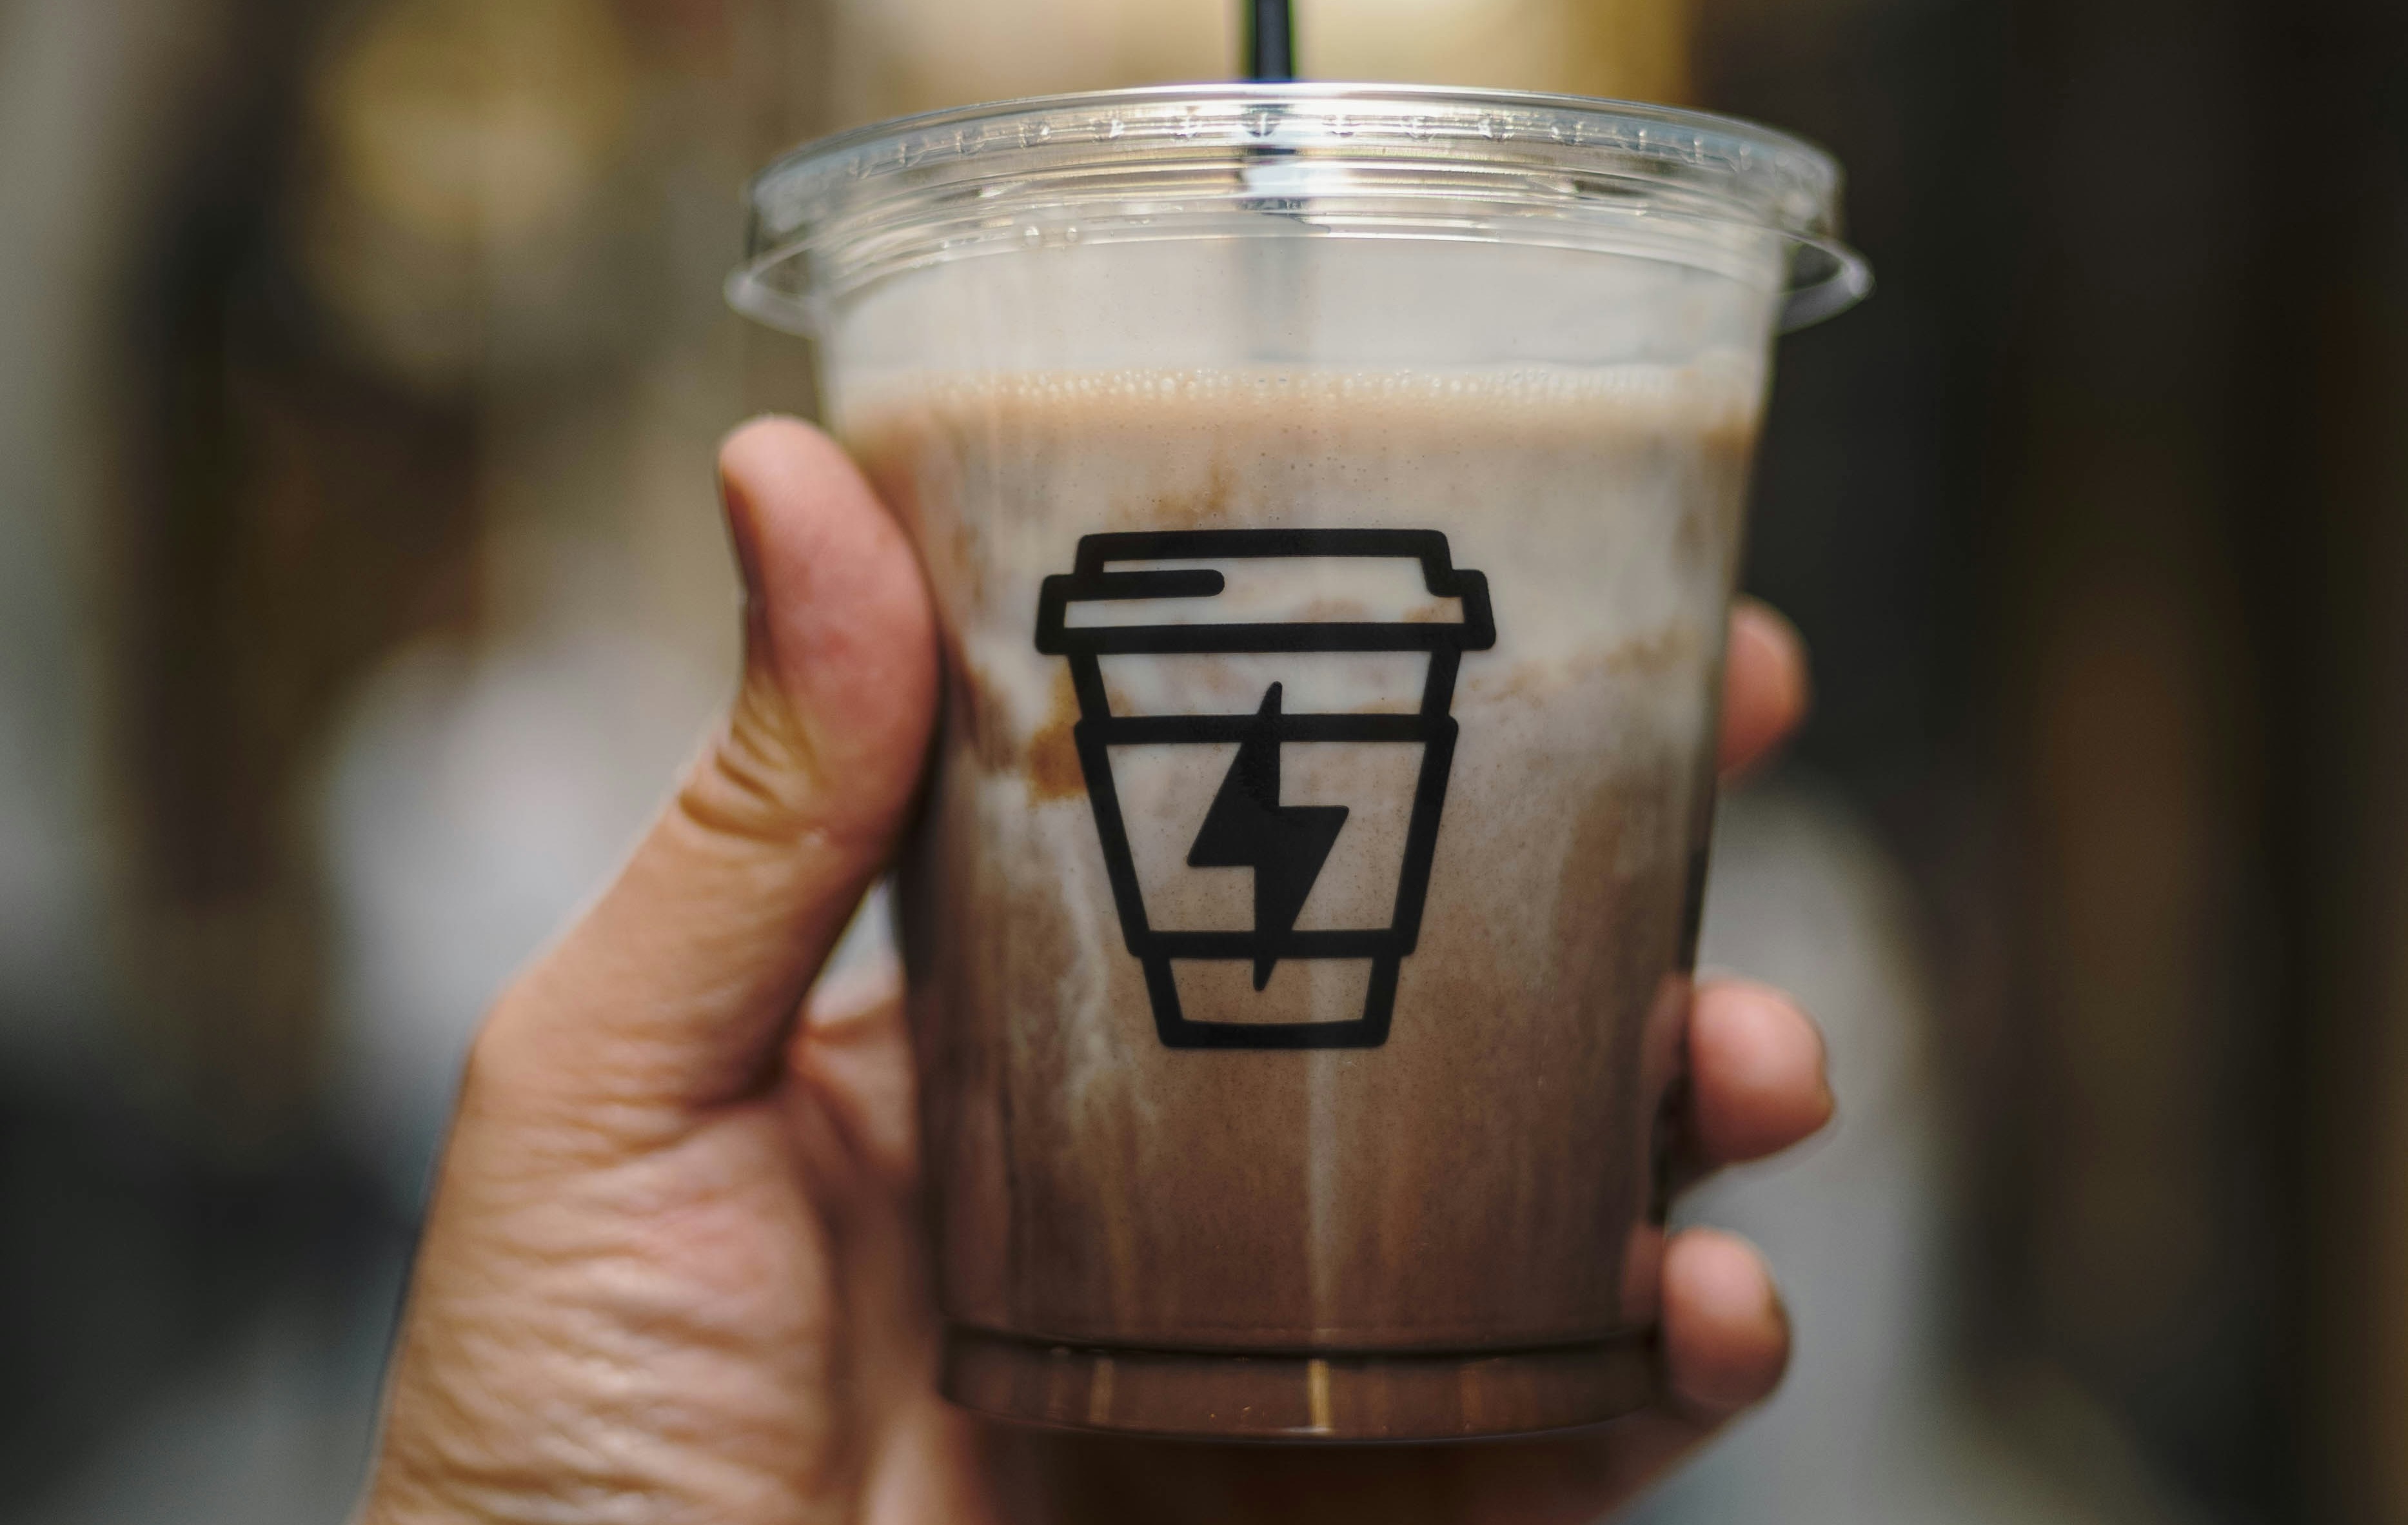

Coffee has been reshaping economies and daily routines since a goat herder in Ethiopia allegedly noticed his flock getting livelier after eating certain berries sometime around the ninth century.
By the sixteenth century, coffee houses in Cairo and Istanbul were centres of commerce and conversation. By the seventeenth, London’s coffeehouses had spawned Lloyd’s of London and the early bones of the Stock Exchange.
The UK spent the next three hundred years as a tea-drinking nation before switching brews. The British Coffee Association now puts daily consumption ataround 98 million cups – enough to fill roughly ten Olympic swimming pools every day. A 2023 consumer survey even found coffee had overtaken tea as the UK’s hot drink of choice.
In independent convenience, that shift has reached a specific and measurable tipping point.
Across January–August 2026, shoppers paid an average £1.67 per serving for RTD coffee versus around 8p for instant.
By June, RTD was generating more han half of all coffee sales value – more than every other coffee format combined. It isn’t being driven by a major expansion in store distribution. RTD and instant are both stocked in roughly nine in ten stores – but RTD is selling increasingly quickly where it is present.
RTD’s share of total coffee sales value in independent convenience rose from 49.1% in July 2025 to 54.4% in July 2026 – a 5.3 percentage-point gain in twelve months.
Instant coffee fell from 31.8% to 27.1% over the same period. Between January and August 2026, RTD accounted for 93% of the total year-on-year growth in coffee sales value.
The crossover happened in June. RTD hit 50.9% that month, climbed to 54.4% in July, and held at 51.3% in August. RTD was already the largest format by July 2025, but its lead over instant has widened sharply year on year.
If RTD’s growth was driven simply by it entering more stores at instant’s expense, you’d expect to see their distribution lines diverge. Yet they haven’t.
Both formats remained at roughly 90% distribution from January 2025 to August 2026. In July, RTD moved only from 90.7% (2025) to 90.9% (2026), while instant went from 90.5% to 89.9%.
The unit rate of sale tells avery different story – though it’s worth noting that RTD and instant are fundamentally different purchase missions. A jar of instant provides around 50 servings as part of a weekly shop. An RTD is a single-serve, on-the-go purchase.Their absolute rates of sale aren’t directly comparable, but the year-on-year direction of travel for each format is.
RTD’s July unit rate of sale climbed from 108.9 in 2025 to 122.5 in 2026 – an increase of approximately 12.5% year on year.
Instant’s unit rate of sale fell from 30.3 to 26.6 – a decline of approximately 12.2% year on year. That pattern has held consistently across every month of the comparison. Similar store distribution, opposite direction of travel.

Even relatively lower-priced RTD brands such as Barista Coffee Co (£1.09 per serving) and Boost (£1.18) cost more than thirteen times the 8p instant average.
The mid-range and top end of RTD tell you how wide the pricing spectrum has become:
The confectionery crossovers approach fifty times the instant average, though both currently account for a negligible share of RTD sales. They're useful as markers of where pricing can go, not as indicators of where the market sits.
The market is also heavily concentrated on both sides:
Coffee input costs surged sharply through 2024 and 2025 as adverse weather hit major producing countries and supply tightened. During that 2024–25 surge, Arabica prices rose by more than 80% and Robusta – widely used in instant coffee – was reported up 92% year on year.
Droughts in Brazil, crop damage in Vietnam, shipping bottlenecks through the Suez Canal and a weaker pound against the dollar have all contributed.
The impact on the two formats is not equal. Instant coffee is more directly exposed to the cost of coffee itself, while RTD contains coffee alongside milk, sugar, flavourings and packaging. That means bean prices are only one component of the RTD cost base, making it a smaller proportion of the total cost.
Retail Spotlight’s pricing data shows both formats have seen per-serving prices rise year on year, with instant moving from 8p to 9p (a rise of roughly 12.5%) and RTD increasing by approximately 3–6% across the monthly series. Rising input costs are a factor across the category, though the gap between 9p and £1.67 remains vast.
Between January and August 2026, RTDs accounted for 93% of total year-on-year coffee category growth by value. In July, for example, total coffee sales grew 6.3% year on year on a like-for-like basis – but RTD alone grew 17.8%. That gap was visible across the summer and tells you how much of the category’s commercial momentum depends on a single format.
Seasonality matters, though. These are the months that naturally favour the chiller over the kettle, and the pattern is consistent with RTD’s seasonal summer strength. Instant is likely to regain some share as temperatures fall. Whether it regains enough to close the gap – or simply slows the rate at which RTD pulls away – is the question the autumn and winter data will answer.
Across January–August 2026 versus the same period in 2025, coffee beans grew 45%, non-dairy RTD 57% and coffee bags 18%.
They remain very small parts of the market – beans sit at roughly 0.3% of category value, non-dairy RTD at 0.2%, bags at 0.2% – but they show that growth isn’t confined entirely to the largest formats. All three sit at price points well above instant: beans average around 31p per cup, bags 37p, non-dairy RTD £1.77.
RTD coffee continues to grow and now generates more than half of convenience coffee sales value. And while Starbucks dominates, there is always opportunity in a growing market. Brands need to understand where their biggest opportunities lie.
That could mean increasing options on the shelf, offering more affordable alternatives at accessible price points, or exploring smaller formats – following a trend already visible in alcohol. It could also mean healthier alternatives that tap into the growing demand for functionality and high protein. Any of these could help challenger brands close distribution gaps, improve rate of sale and give Starbucks some healthy competition.
Store-level data can reveal where those opportunities exist and help brands make smarter decisions about ranging, pricing and seasonality.
If you’d like to see what the data looks like for your brand specifically, that’s the kind of question we love answering!
Hit the contact us button below to get in touch.